Best Data Visualization Tools in 2025: Unleashing the Power of Your Data

In a world where data is the new oil, the ability to present information clearly and understandably is becoming increasingly important. Data visualization tools play a central role in this: they transform complex datasets into easy-to-understand graphics, dashboards, and charts. Whether you’re planning a project, making data-driven decisions, or simply staying organized – the right tool makes all the difference.
But which data visualization tool is best suited to your needs? In this article, we’ll explore the top tools for 2025, their features, strengths, and weaknesses. Whether you’re a beginner, a professional, or part of a team – you’re sure to find the perfect solution here.
Why Data Visualization Matters
A visualization helps transform complex data into an easily understandable format, allowing viewers to quickly identify patterns, relationships, and trends. Without data visualization, many data-driven decisions would not only be slower but also more error-prone. Here’s why data visualization is so important and what would happen if it didn’t exist:
- Easier Pattern Recognition: Visualizations help quickly identify patterns and trends in large datasets, making analysis more efficient.
- Faster Decision-Making: Interactive dashboards and charts provide immediate access to relevant information, enabling fast, informed decisions.
- Improved Communication: Complex data is presented in a way that can be easily understood by both experts and non-experts.
- Anomaly Detection: Outliers and irregular patterns in data are quickly visible in visualizations, which is crucial for error detection.
- Enhanced User Experience: Interactive visualizations allow users to explore and customize data analysis.
- Support for Big Data Analysis: Visualizations make large datasets more manageable and facilitate efficient big data analysis.
- Fostering a Data-Driven Culture: Companies can build a culture of data-driven decision-making by making data accessible to all employees.
Without data visualization, much of the valuable information would be hidden in a sea of numbers, significantly complicating decision-making. In many cases, analysts and managers would have to spend hours or even days sifting through large datasets to extract patterns and relevant information. Such an approach would not only be time-consuming but also prone to human error.
Key Factors in Choosing a Data Visualization Tool
There are numerous data visualization tools on the market, each with its own strengths and features. To find the right tool, several key factors should be considered:
- User-Friendliness: A good tool should be intuitive and easy to use. Especially for beginners, it’s important that the interface is clearly structured and can be utilized with minimal learning effort.
- Data Sources & Integration: Ensure that the tool supports the data sources you work with. Many tools allow for easy importing of data from various databases, Excel files, or APIs, which reduces the workload.
- Visualization Options: Check if the tool offers a variety of visualizations such as charts, maps, heatmaps, and interactive dashboards. Flexibility in presentation helps extract the right insights from the data.
- Scalability & Performance: For larger datasets and complex analysis, the tool needs to be powerful and scalable. It should handle growing data volumes without sacrificing performance.
- Collaboration Features: Especially in team environments, it’s crucial that visualizations can be easily shared and collaboratively edited. Tools offering cloud-based collaboration provide a clear advantage.
- Cost: Tool prices vary greatly depending on their features. It’s worth choosing a solution that fits your needs without exceeding your budget. Many tools also offer free trials to test out their capabilities in advance.
These factors will help guide you in selecting the best data visualization tool for your needs, whether you are a beginner or an advanced user.
Top Data Visualization Tools in 2025
Choosing the right data visualization tool can make all the difference when it comes to presenting data in a clear and impactful way. In 2025, there are a variety of tools available, each offering unique strengths based on specific needs and use cases. Here are the best data visualization tools you should consider in 2025:
Tableau
Tableau is one of the leading data visualization tools, used by both beginners and professionals. With a user-friendly interface, a wide range of visualizations, and powerful analytical features, Tableau is ideal for businesses of all sizes. It allows easy integration of data sources and supports interactive dashboards, enabling users to explore data dynamically.
Power BI
Microsoft’s Power BI is another highly popular data visualization tool. Known for its seamless integration with the Microsoft product suite, Power BI is perfect for businesses already using Microsoft applications. It offers a user-friendly interface, extensive visualization options, and robust reporting and analytical capabilities. Additionally, its basic version is affordable, providing excellent value for money.
Qlik Sense
Qlik Sense is renowned for its self-service data analysis and visualization features. It offers an intelligent, user-friendly interface that allows even non-data experts to gain deeper insights into their data. With its powerful search and navigation functions, Qlik Sense helps users quickly and efficiently discover and visualize relevant data.
Google Data Studio
Google Data Studio is a free data visualization tool that is particularly useful for small businesses or individuals. It enables the creation of interactive dashboards and reports and integrates seamlessly with Google products like Google Analytics, Google Ads, and Google Sheets. With an intuitive drag-and-drop interface, it’s ideal for users who want to quickly create visual reports.
D3.js
D3.js is a JavaScript library that allows developers to create custom visualizations. It excels at creating complex, interactive, and tailored visualizations that offer deeper insights into data. However, D3.js has a steeper learning curve compared to many other tools, making it more suitable for developers and advanced users.
Sisense
Sisense provides a powerful business intelligence platform that enables users to analyze and visualize large datasets in real-time. With strong backend data processing and a user-friendly interface, Sisense is especially well-suited for companies needing to perform complex data analysis.
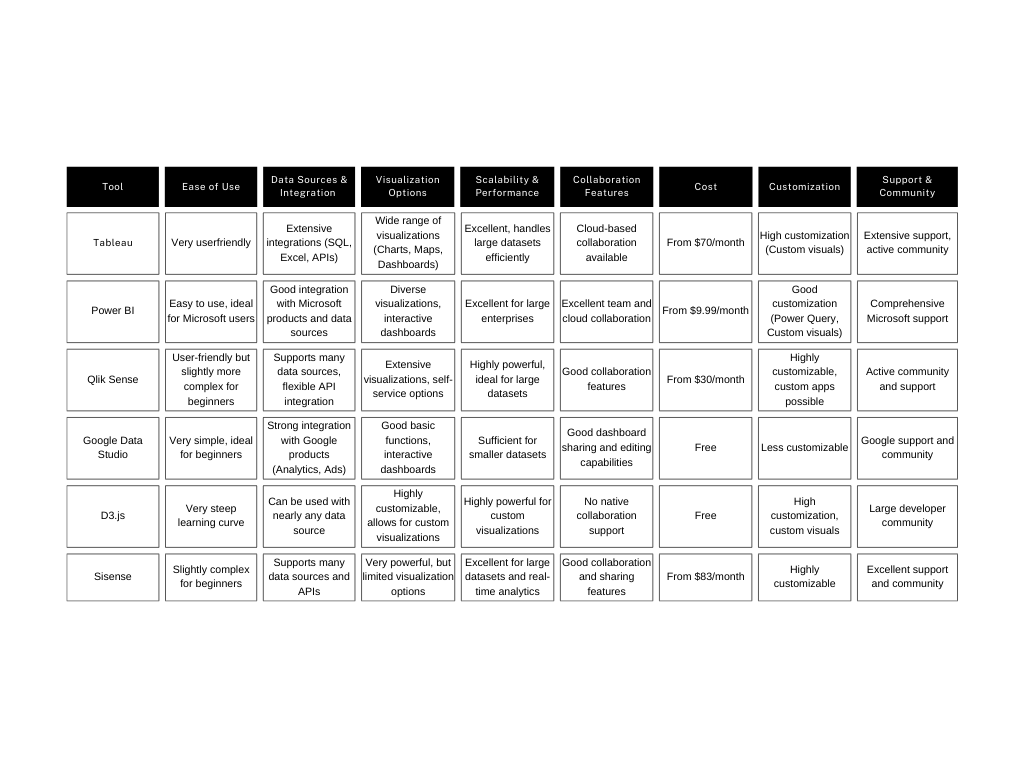
Comparison Table

Conclusion
Choosing the right data visualization tool can significantly impact the success of your data analysis. Whether you’re a beginner or an experienced professional, there is a tool to meet your needs. Tools like Tableau, Power BI, and Qlik Sense offer comprehensive features for complex data visualizations, while Google Data Studio and D3.js are particularly suited for beginners and developers. Remember, data visualization not only enhances the efficiency of your analysis but also leads to better, faster decision-making.


